Process Visualization: How to Understand and Optimize Complex Workflows Through Visualization

In a world characterized by increasing complexity and digital transformation, companies face a central challenge: How can invisible processes be made tangible for all stakeholders? The answer lies in a method that goes far beyond the traditional flowchart. With a strategically designed process visualization, you create clarity, foster acceptance, and establish a solid foundation for sustainable process management.

In this guide, you will learn why process visualization is the key to successful process optimization and how to strategically implement this tool within your company.

What Is a Process Visualization? A Definition

Before we dive deep into the methodology, let’s clarify the term. A process visualization is a graphical representation of a workflow or an entire value chain. Unlike purely technical models (such as BPMN 2.0)—which are often abstract and difficult for non-specialists to interpret—a professional process map employs narrative and illustrative elements.

It serves as a "roadmap" of your organization. You can see not only what is being done, but also who is doing it, what resources are being utilized, and where the critical points lie.

Why Process Visualization Is Indispensable for Your Business

Humans are visual beings. Our brains process images approximately 60,000 times faster than plain text. When introducing complex strategies or new software workflows, a manual is often simply not enough.

The Benefits at a Glance:

1. Shared Understanding: You eliminate misunderstandings, as all stakeholders are looking at the same visual foundation.

2. Identification of Weaknesses: Process visualization often makes bottlenecks, redundancies, and media breaks visible at a glance.

3. Increased Acceptance: An engagingly designed visual is more likely to motivate employees to engage with new procedures than a dry Excel spreadsheet.

4. Efficient Onboarding: Through a process visualization, new team members can understand in no time how their role fits into the overall picture.

Process Management and the Process Visualization: A Symbiosis

Effective process management requires data, but also communication. The process visualization bridges the gap between theoretical analysis and practical execution.

Integration into the PDCA Cycle

If you apply the classic Plan-Do-Check-Act cycle, visualization provides valuable support in every phase:

- Plan: You sketch the target process.

- Do: The visualization serves as a guide for the workforce.

- Check: During an audit, you can mark deviations directly on the visualization.

- Act: Optimizations are immediately documented visually.

Step by Step to the Perfect Process Visualization

Creating a high-quality process visualization is not a matter of chance, but rather a structured workshop process. Here is how we at DIALOGBILD approach it:

1. Defining Objectives and Target Audience

Ask yourself: Who is intended to view this image? Is it the executives who require an overview of the strategy, or the staff members who need to understand the details of day-to-day operations? The level of detail in your process visualization depends significantly on this factor.

2. Information Gathering (Scoping)

In this phase, you gather all relevant information. Conduct interviews with "Process Owners" and utilize existing documentation. A crucial point here is this: Listen to the people on the ground! The "actual process"—the way it is lived day-to-day—often differs massively from what is written in official manuals.

3. Structuring and Storytelling

A good visual requires a clear reading direction. Whether flowing from left to right, arranged as a cycle, or presented as a "journey"—the structure must be logical. We embed the hard facts of process management within a narrative; this makes the content memorable.

4. Visual Implementation

This is where graphic metaphors come into play. A mountain might represent a major challenge, a lighthouse could symbolize the vision, and a construction site might stand for ongoing process optimization.

Process Optimization through the "Visual Look"

How, specifically, does visualization help to increase efficiency? When you visualize your workflows, the following effects frequently occur:

- Elimination of "Siloed Knowledge": Since the entire workflow is transparent, reliance on specific individuals is reduced.

- Standardization: The visual representation defines the "Gold Standard." Deviations are immediately recognized as such.

- Error Reduction: Clear lines of responsibility (Who does what?) prevent tasks from falling through the cracks.

Comparison: Traditional Flowcharts vs. Illustrative Process Visuals

 Feature  Flowchart

(BPMN/UML)

 Illustrative
Process Visual

Target Audience  IT Specialists,

Process Experts

 All Employees,

Stakeholders, Customers

Level of abstraction Very High (Symbols)
Low

(vivid, approachable)

Emotionality Neutral / Objective
Motivating /

Identity-building

Area of ​​Application System Architecture,

Automation

Change management,

Training, strategy

Conclusion: The Process Map as a Compass for Change

A process visualization is far more than just a "pretty drawing." It is a strategic management tool that leverages process visualization to drive genuine behavioral change. If you aim to practice sustainable process management and establish a culture of continuous process improvement, visually mapping out your workflows is the most efficient path to take.

In doing so, you create not only transparency but also trust. After all, when people understand what they are doing—and why they are doing it—they work with greater motivation and a stronger sense of purpose.

Would you like to visualize your processes?

Are you ready to reduce complexity within your organization and bring your employees along on the journey? DIALOGBILD GmbH helps you transform your unique workflows into a meaningful, cohesive visual narrative.

Contact us for a no-obligation consultation, and let’s design your first process map together!

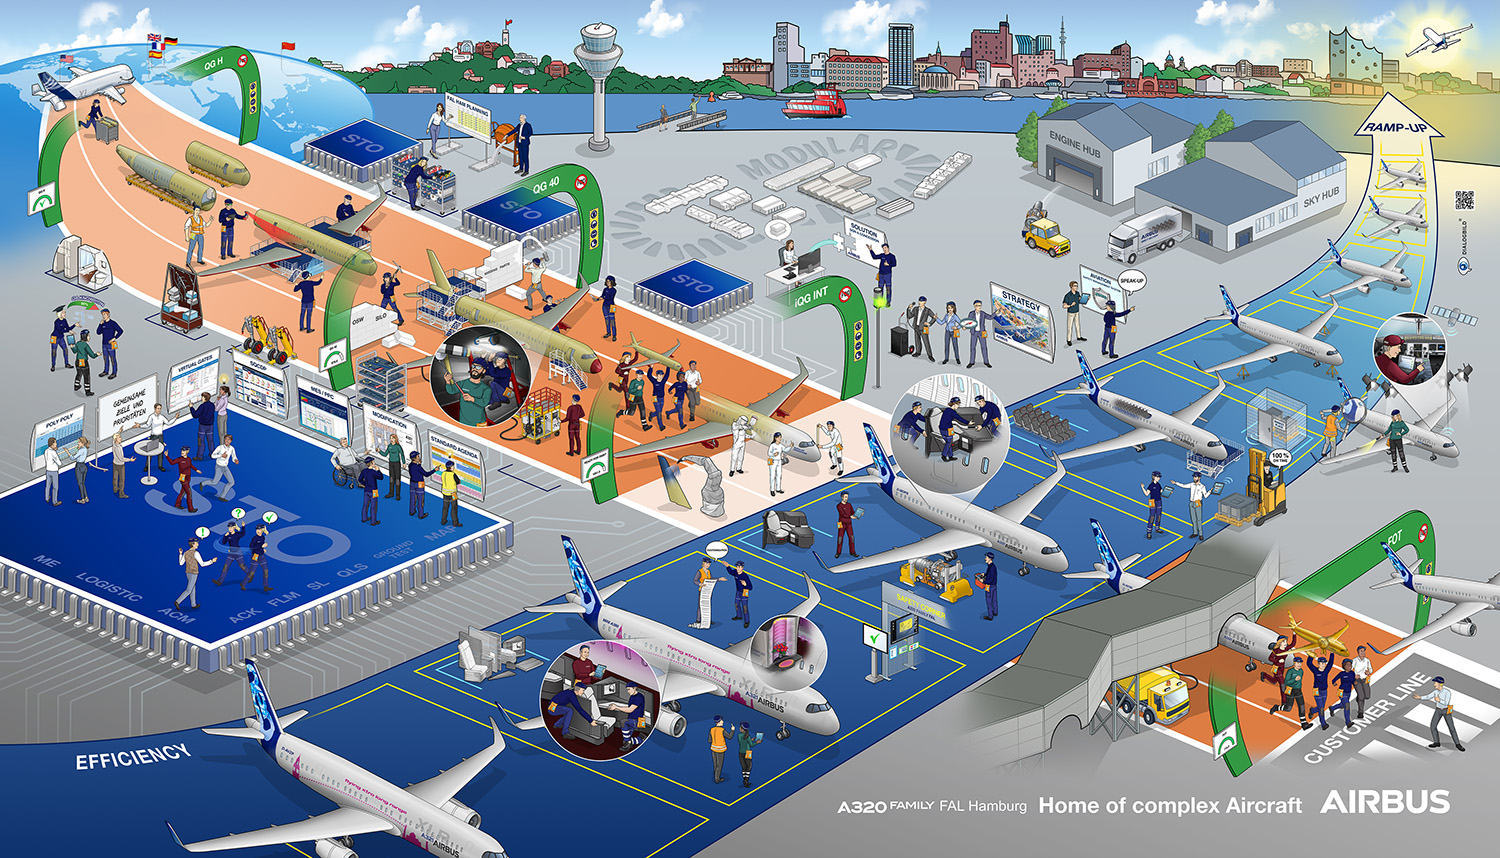
A DIALOG PICTURE FOR AIRBUS AND THEIR NEW MODULAR CONCEPT


The Airbus plant in Hamburg-Finkenwerder is the largest Airbus site in Germany. Among other things, this is where the final assembly of the well-known A320 family takes place. As part of an internal restructuring, sequential line production is being converted to a mixed production organization, with the first half of production taking place in a synchronized area and the second half at a modular station. This means that various activities per aircraft that currently take place at several stations will be carried out at a single station.

The new modular concept is to be made visually understandable to production employees with the aid of a dialog picture, and the advantages and opportunities for all those involved are to be highlighted.

During a comprehensive tour of the factory, the DIALOGBLD team had everything shown to them in detail and took photos so that the individual machines and production steps could be depicted as authentically as possible in the final dialog picture.

The finished dialog picture will be displayed prominently in the production halls for everyone to see and will be used for internal workshops. ...

Schaeffler Fabrik der Zukunft Zero Emission Company 3D Grafik Dialogbild Agentur für Visualisierung von Prozessen, Veränderungen und Visionen.

Schaeffler Fabrik der Zukunft Zero Emission Company 3D Grafik Dialogbild Agentur für Visualisierung von Prozessen, Veränderungen und Visionen.

3D-INFOGRAPHIC: SCHAEFFLER PRODUCTION

BMW HVS-Navigator Entwicklung E-Antrieb Prozessvisualisierung Erklärbild Dialogbild Agentur für Visualisierung von Prozessen, Veränderungen und Visionen.

Logo von BMW

E-DRIVE DEVELOPMENT

THINKING ABOUT TOMORROW'S OPPORTUNITIES

With 31 production and assembly plants in 15 countries, the BMW Group is today one of the world's leading premium car manufacturers. The BMW Group is responding to the current age of electric mobility with clear and forward-looking visions of electric cars that are already thinking about the possibilities of tomorrow. The processes along the way are complex and require coordinated and targeted development steps. ...

ALMO B.Braun Zielbild Leitbild Strategiebild Dialogbild Agentur für Visualisierung von Prozessen, Veränderungen und Visionen.

THE TARGET PICTURE


Creating transparency about the target system, making it understandable and easy to communicate to all employees, providing the opportunity for personal identification and describing the way into the future to ultimately provide a higher-level orientation for the entire company - these were the reasons why ALMO decided to create a dialog picture.

Together with DIALOGBILD and Goldpark as professional partners, a dialog picture was developed and implemented for ALMO. During the first step, the already existing target system was supplemented by a „north star“ and derived core statements. This creative process was moderated and supported by Goldpark.

The target picture was developed on the basis of the „north star“, key messages and ALMO's strategy and corporate mission statement. It was important for the company to integrate employees and executives into the development process. Therefore, executives and employees of all departments as well as members of the works council participated in three workshops.

The target development workshops were presented by DIALOGBILD in an open and integrating way. The participants were able to voice their opinion and their thoughts and DIALOGBILD managed to enthuse everyone - including the critics - for the target picture and ensure the personal identification with the images content. This created a positive undertone for the target picture even before its official implementation.

DIALOGBILD provided the ideas for the implementation of the target picture as part of an interactive event and also supported ALMO during the event. Goldpark was an important source of ideas, especially in the development of the target pictures content, the description of the „north star“ as well as preparing the executives for the target picture implementation.

Airbus A320 A321 Ausrüstungsmontage 2.0 Single Aisle Dialogbild Agentur für Visualisierung von Prozessen, Veränderungen und Visionen.

STRATEGY MAP: SINGLE AISLE

Aircrafts of the A320-family from Airbus are among the best selling aircraft worldwide. The depicted A321 model is a single aisle airplane with a capacity of up to 240 passengers and a range of up to 5,500 kilometers. As XLR-variant the airplane, equipped with additional tanks, is meant to reach a range of up to 8,700 kilometers. As final member within the Airbus Aerostructures GmbH in the location Hamburg-Finkenwerder, our picture depicts the entire system installation in the rear part of the assembly section and the further handover to Airbus FALs (Final Assembly Lines) in Germany, France, China and the USA. ...

Frequently Asked Questions (FAQ) about the Process Map

1. What distinguishes a process visualisation from a flowchart?

While a classic flowchart (e.g., in BPMN) typically depicts purely logical sequences and technical branching using standardized symbols, a process visualisation employs illustrative elements and metaphors. It makes visible both the "spirit" of the process and the people involved. It serves less as a technical manual and more as an intuitive roadmap for the entire workforce.

2. For which business areas is process visualization suitable?

Fundamentally, for all of them! However, it is particularly valuable in areas where interface issues exist or where complex changes are imminent. Typical areas of application include:

  • Onboarding: New employees immediately grasp the interconnections.
  • Change Management: Visualizing the "target state" following a transformation.
  • Compliance & Security: Clearly illustrating critical codes of conduct.
  • Sales & Service: Clarifying the customer journey.

3. How long does it take to create a custom process visualization?

This depends heavily on the complexity of the subject matter. As a general rule, we estimate a timeframe of 4 to 8 weeks for a professional dialog picture. This process encompasses the research workshops, the sketching phase, feedback management, and the final graphic execution.

4. Do I need pre-existing process descriptions for process visualization?

No, not necessarily. Companies often use the work involved in creating a process visualisation as an opportunity to properly define—or even critically re-evaluate—their workflows for the first time. As part of our process optimization services, we assist you in bringing the implicit knowledge of your experts to light and structuring it graphically.

5. In which formats is a process visualisation provided?

Typically, you will receive your image in various digital formats (e.g., high-resolution PDF, JPEG, PNG). Many clients also utilize the process visualisation in analog form:

  • As a large-format wall print for offices or production halls.
  • As an interactive click-map on the intranet.
  • As a fold-out chart for a lab coat pocket or manual.

6. How sustainable is a process visualisation in the face of constant process changes?

A well-designed process visualisation features a modular structure. Minor adjustments to process execution can be quickly updated graphically. In the event of radical shifts in process management, the map also serves as a valuable historical record upon which new optimizations can be built.

7. Can a process visualisation also be used for IT implementation?

Absolutely. While it does not replace technical specifications for developers, it serves as a "translator" between business departments and IT. It ensures that the software ultimately meets the actual needs of the users.