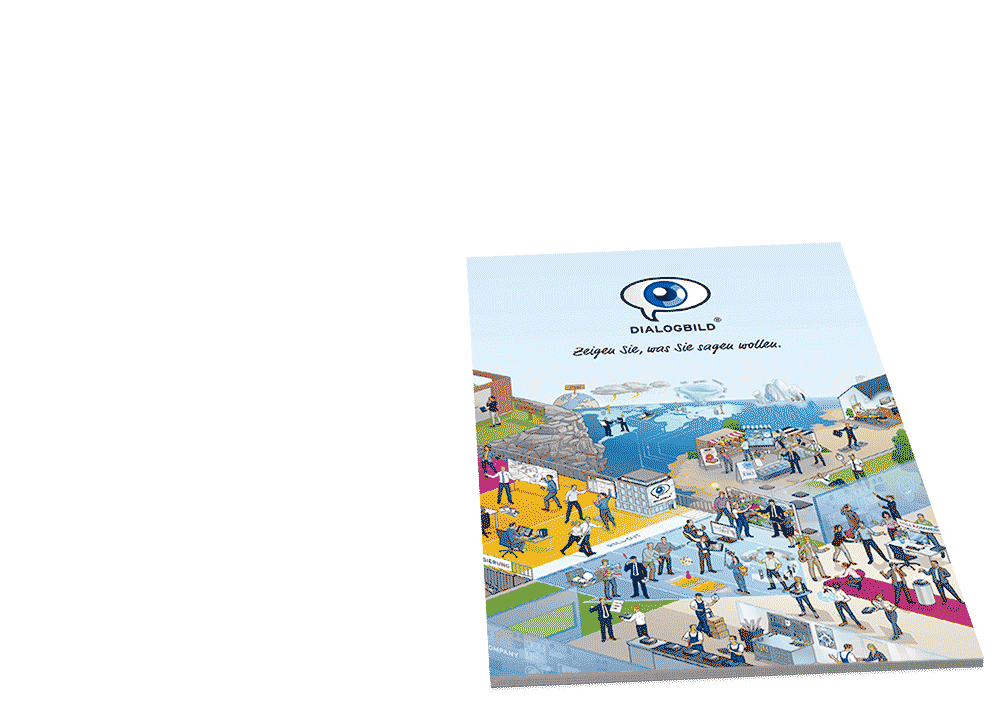


Process visualization
In this guide, you'll learn what process mapping is, which symbols and tools are used, how to use a flowchart for process visualization, and how Dialogbild can help you professionally design and optimize your processes.
What is process visualization?
Process visualization describes the visualization of workflows and business processes. The goal of this method is to make complex processes understandable, clarify responsibilities, and identify optimization opportunities. Companies use process mapping to bring clear structure to their workflows, visualize dependencies, and increase efficiency.
By modeling processes, companies can:
- Represent process flows: Individual steps of a process are graphically represented and logically linked.
- Clarify responsibilities: It becomes clear which department or person is responsible for which step in the process.
- Identify inefficiencies: Weaknesses or bottlenecks in the processes become visible and can be specifically remedied.
The importance of process visualization
A well-modeled process helps bring clarity and transparency to workflows. This leads to several advantages:
1. Improved communication: All participants understand the flow of a process and know what their responsibilities are.
2. Increased efficiency: Visualization identifies unnecessary steps, avoids duplication, and speeds up processes.
3. Error minimization: Clearly defined processes reduce the risk of errors and misunderstandings.
4. Better collaboration: Process mapping promotes understanding between departments and teams, as everyone sees the same processes.
Flowchart: The classic form of process visualization
A flowchart is one of the most commonly used tools for process representation. It shows the flow of a process using symbols and arrows that represent the sequence of individual steps and the relationships between them.
Important symbols in flowcharts:
- Oval: The start and end point of a process.
- Rectangle: A process step or task.
- Diamond: A decision that can direct the process in different directions.
- Arrows: Connections between the individual steps that represent the process.
A flowchart provides a clear and concise structure that allows processes to be quickly grasped and understood. It also helps identify dependencies and interactions between the individual steps of the process
The modeling of processes
Process modeling is a structured process for analyzing, documenting, and optimizing processes. The first step is to identify the individual process steps and determine their sequence. This not only represents the core processes, but also considers supporting processes and interfaces between departments.
Process modeling involves several steps:
- Process mapping: Gathering information about existing processes.
- Process analysis: Examining efficiency and identifying weaknesses.
- Process design: Redesigning processes to make them more efficient.
- Process mapping: Visually representing new processes, e.g., in a flowchart.
Process modeling is useful not only for existing processes but also when introducing new workflows. It ensures that all participants understand the processes and that they can be implemented efficiently.
Process symbols: The language of process visualization
A standardized symbol language is used to visualize processes, making it easier to represent procedures consistently. Some of the most important process symbols are:
- Process (rectangle): Represents an activity or work step.
- Decision (diamond): Indicates a point in the process where a decision must be made.
- Start/End (oval): Marks the beginning and end of the process.
- Document (rounded rectangle): Indicates a step where a document is created or processed.
- Data flow (arrows): Connects the symbols and indicates the direction of the process.
These standardized symbols ensure that the process visualization is easily understood by all involved and misunderstandings are avoided.
Tools for process visualization
There are numerous process mapping tools that help companies efficiently model and visualize their processes. Among the most popular are:
1. Microsoft Visio: One of the most widely used tools for creating flowcharts and other process visualizations.
2. Lucidchart: A cloud-based tool particularly suited for team collaboration, enabling simple, intuitive process models.
3. BPMN tools: BPMN (Business Process Model and Notation) is a standard for graphically representing business processes and is used in specialized tools such as Bizagi or Camunda.
Choosing the right tool depends on your company's needs. Some tools offer specialized features for process automation, while others are particularly well-suited for team collaboration.
How Dialogbild as an agency can help with process visualization
Visualizing and modeling processes can be complex, especially in larger companies with multiple departments and interfaces. Dialogbild is a specialized agency that supports companies in creating customized visual process visualizations.
1. Customized visual process solutions: Dialogbild develops customized visualizations that are precisely tailored to your company's needs. Whether simple flowcharts or complex process landscapes – we ensure that your processes are presented clearly, understandably, and efficiently.
2. Efficient communication: Our process visualizations are designed to improve internal communication within your company. Employees and departments receive a clear overview of processes and can better understand and implement their tasks and responsibilities.
3. Process optimization: In addition to visualization, we also support companies in process optimization. Through the visual analysis of process flows, we identify bottlenecks and inefficiencies that can be eliminated to optimize your business processes.

QUALITY FOR LIFE
THE MISSION STATEMENT
AL-KO Therm provides for a perfect climate with individualized, economic and ecological concepts. The enterprise is a specialist in ventilation equipment which is characterized by the latest technology, quality, reliability and consistently meeting customer requirements. It has developed sophisticated high tech facilities with the best room air quality in office buildings or hospitals and precisely controlled air in production facilities as well as for effective solutions for large commercial or leisure complexes. The most attention is given to the development of energy-economical technology for environmental discharge and cost reduction. In order to support the strategic transformation and the relationship between a growing self-image and the corporate philosophy, we developed a mission statement together with inGenics AG. ...

THE TARGET PICTURE
FÜR ALMO PRODUCTS
Creating transparency about the target system, making it understandable and easy to communicate to all employees, providing the opportunity for personal identification and describing the way into the future to ultimately provide a higher-level orientation for the entire company - these were the reasons why ALMO decided to create a dialog picture.
Together with DIALOGBILD and Goldpark as professional partners, a dialog picture was developed and implemented for ALMO. During the first step, the already existing target system was supplemented by a „north star“ and derived core statements. This creative process was moderated and supported by Goldpark. ...

CORPORATE MISSION STATEMENT LOGISTICS
INDIVIDUAL, INNOVATIVE & PROACTIVE
The Festo Group provides answers to questions in the field of automation technology. The success of these answers is demonstrated by the 300,000 customers worldwide from over 35 industries in 176 countries. If one of the approximately 33,000 catalog products is not suitable, Festo will develop customized customer solutions: Individual, innovative and proactive.
In order to drive forward its own internal development within OPEX, Festo initiated the collaboration with DIALOGBILD. The goal was to communicate to employees at first glance where their own work area is and which topics also interact across the board. ...
Frequently asked questions
What is a process visualization?
A process visualization is a method for visually representing and understanding business processes. It helps structure workflows, clarify responsibilities, and identify optimization potential. Diagrams or flowcharts are often used for this purpose.
Why is process visualization important?
A good process visualization promotes:
- Clarity: All participants understand the process and their tasks.
- Efficiency: Unnecessary steps and bottlenecks become visible, allowing processes to be optimized.
- Error reduction: Clearly defined processes help avoid errors and misunderstandings.
- Better collaboration: Teams and departments work together more efficiently because everyone is familiar with the same process structure.
What is a flowchart?
A flowchart is a graphical representation of a process in which the individual steps are represented by symbols and connected by arrows. It shows the sequence of steps and decision points in the process flow. Flowcharts are ideal for clearly illustrating the flow of both simple and complex processes.
Welche Symbole werden in der Prozessdarstellung verwendet?
Zu den wichtigsten Prozesssymbolen gehören:
- Rechteck: Stellt einen Arbeitsschritt oder eine Aufgabe dar.
- Oval: Zeigt den Start- oder Endpunkt eines Prozesses an.
- Raute: Markiert eine Entscheidung, die den Prozess in verschiedene Richtungen lenkt.
- Pfeile: Zeigen den Fluss oder die Reihenfolge der Prozessschritte an.
Which symbols are used in process diagrams?
The most important process symbols include:
- Rectangle: Represents a work step or task.
- Oval: Indicates the start or end point of a process.
- Diamond: Marks a decision that directs the process in different directions.
- Arrows: Indicate the flow or sequence of process steps.
How does process visualization help with process modeling?
Process visualization involves analyzing, designing, and optimizing workflows. A clear process mapping visualizes all steps of a process, making it easier to identify dependencies, identify bottlenecks, and make processes more efficient.
What are the advantages of process visualization?
Process visualization offers many benefits:
- Clarity: Complex processes are made more understandable.
- Optimization: Inefficiencies and unnecessary steps become visible, leading to process improvements.
- Better communication: Teams can clearly understand who is responsible for each process step.
- Standardization: Process mapping helps establish consistent processes within the company.
When should a company use a process visualization?
A process visualization is useful when:
- A new process is being developed.
- Existing processes need to be optimized.
- Collaboration between departments needs to be improved.
- Employees need to be trained to understand new processes.
- Business processes need to be standardized.
Can a process visualization help with employee training?
Yes, a process visualization is an effective training tool. It makes processes understandable and provides employees with clear guidance on how workflows work and the steps they need to perform. Flowcharts and other visual representations simplify complex content and promote learning.
How can Dialogbild help with process visualization?
Dialogbild offers customized visual solutions for process visualization. We help companies present their processes clearly, understandably, and efficiently. Our services include:
- Customized process visualizations: Creation of diagrams and flowcharts tailored to your company's specific needs.
- Process optimization: Identification of weaknesses and potential for improvement in existing processes.
- Interactive visualizations: Designing interactive process representations that support the learning process and promote employee engagement.